That’s it, you’ve made it. A Big Data Analytics team has been implemented in your company.
A few use cases have been identified and for now, they are executed on in a first come first served basis. Soon, these cases will generate tangible results for the organisation and gradually, Big Data Analytics will get more traction, thus generating more use cases. Have you already thought about the prioritisation process that will accompany this pipeline of cases? Surely demand won’t be met with an extended supply of Data scientists. So, how will you determine which cases should be worked on first? How will you explain your decisions to management and your users?
Well, we could take the approach of identifying cases generating the most revenues. This can make sense. It supports funding the investment made in Big Data Analytics and provides short term and visible gains to the organisation. We’re talking here about use cases identifying new business opportunities through cross selling or up-selling, and also development of new products or services. Let’s call them the obvious ones. Once presented with the potential of Big Data Analytics, people can rapidly come up with many suggestions leading to the development of such cases.
But what about the other types of use cases? The ones dealing with improvement in operational efficiency through advanced analytics on operational drivers for instance. Those too can generate significant savings. Say you manage to identify which clients are the most time consuming across your organisation i.e. not only in customer support and sale but also in operational activities such as admin support, accounting, IT, etc. Doing so would allow you to re-shuffle some of your activities or the type of services you provide to these clients and in turn, decrease your cost base. The gains resulting from improvements in operational efficiency are believed to be much bigger than the ones resulting from increased sales.
Say now that we focus on use cases related to risk management or fraud detection. A simple search on the Internet will retrieve several examples of these. Retail banks, financial institutions, insurance companies benefit from applying Big Data Analytics to detect fraudulent activity. Not only can it assist in avoiding significant losses but also, in some cases, avoiding fines related to unlawful trading activities.
All these cases share a common denominator: tangible benefits measured in terms of additional revenues, cost savings or cost avoidance. This is a key element in the process of prioritising the use cases for your Big Data Analytics initiative. This is the obvious approach for any manager willing to grow his business or control his costs. But if one wants to secure the future of this initiative, using this one element as the foundation of the prioritisation process might fall short of expectations or ambitions.
This is the conundrum we are facing with Big Data Analytics. What prioritisation process should we use to select use cases that ensure not only short term gains but also all potential gains in the long run?
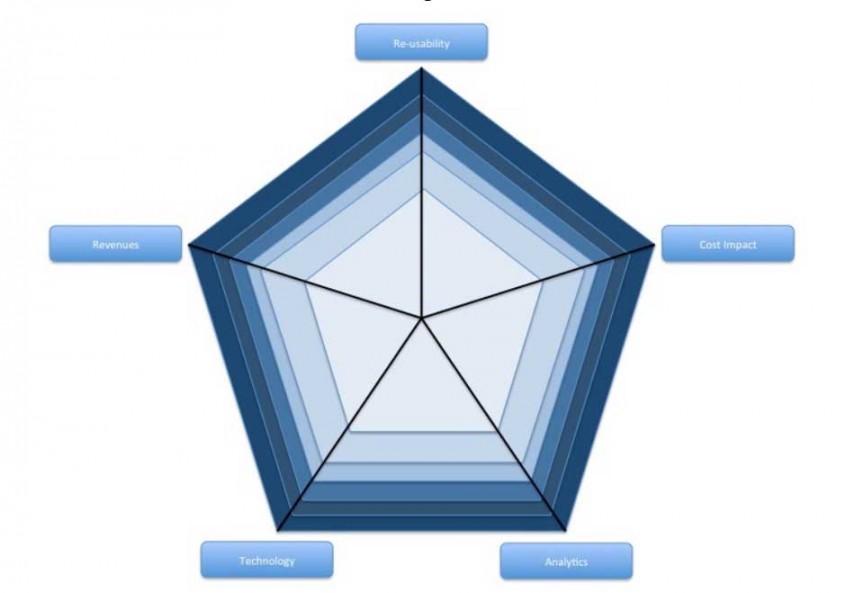
A solution would be to consider, in parallel to the tangible benefits, dimensions allowing for the development of your Big Data Analytics expertise. To that end, I’d like to introduce the Prioritisation Pentagon.
To start with, tangible benefits are split into two categories:
- Revenues measure the potential for new revenue generated by the use case as a result of e.g. cross-selling, up-selling, new products, new services, etc
- Cost Impact measures the potential gains in terms of cost savings or cost avoidance
The reason to split these is linked to a need for transparency in the selection process.
Next to these comes Re-usability. When working on Big Data Analytics, there is a strong probability that each use case will be different than the other. There is nothing wrong with this as it allows exploring various topics. However, this also means that for each new use case, a fresh process of analytics needs to be initiated. One key to the success of Big Data Analytics initiatives lies in their ability to prove their added value, but also to impose, in the long-term, their footprint in the company. And what better way to do so than developing solutions which could be re-used. So, simply stated, there might be cases that won’t bring immediate significant gains BUT because the analytics solution that will have been developed is re-usable, the cumulative long-term gains might be significant.
Big Data Analytics is considered by some an innovation, and others an evolution. Whatever your position on that point, one thing for sure is that the technology behind it keeps evolving….fast. Hence the need for the fourth dimension of this pentagon: Technology. Use cases which require a Big Data technology that wouldn’t be part of your stack are definitely worth considering. Why? Because those cases will help the evolution of your Big Data technology ecosystem. It will also make it better performing, reliable, efficient, and redundant.
As a final dimension, when prioritising these use cases, we should pay attention to the type of Analytics that can be performed. The beauty of Big Data Analytics is the ability to explore the boundaries of all types of analytics. One shouldn’t be limited to linear regressions, correlations or Bayesian rules. All types of analytics should be explored: text mining, machine learning, natural language processing, advanced visual analytics, etc.
One bonus of the last two dimensions is that they will also allow your team to experiment and innovate which will keep them challenged. And clearly, for these types of individuals (e.g. data scientists, data engineers, big data architects, analytics architects), this is a strong motivator.
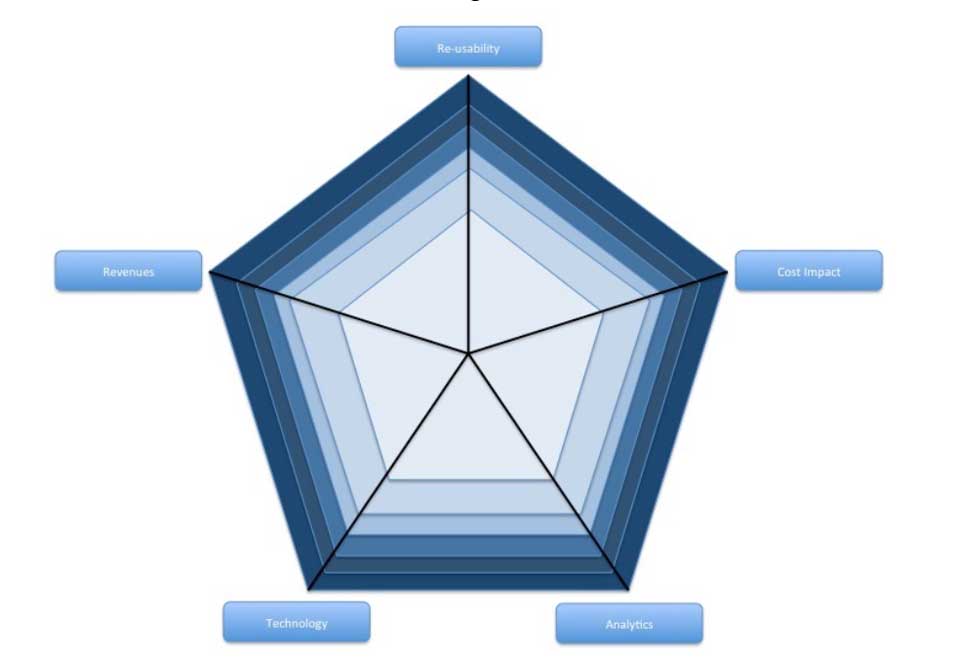
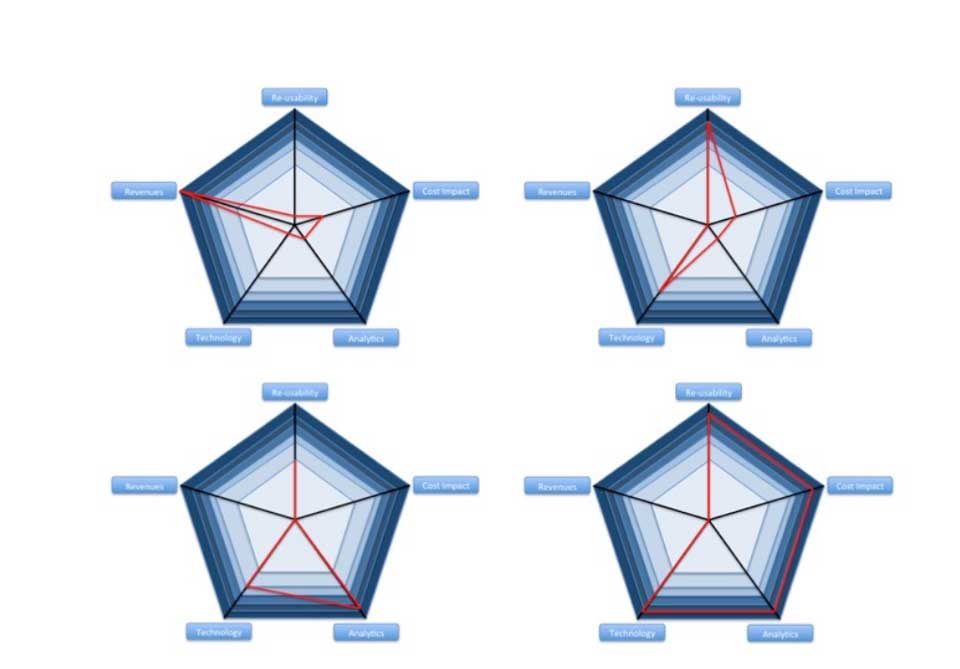
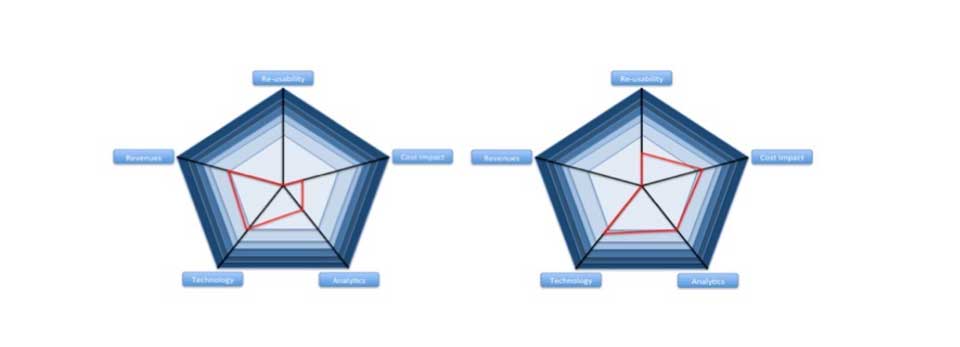
Well, it is very simple. If a use case manages to get a high rating (dark colours sections) in at least one of the categories, it should be considered first priority. If not (light colours sections), priority should be lower and the use case handled whenever there is excess capacity. Obviously, it is up to each organisation to determine appropriate scales depending on their appetite and strategy alignment for each dimension. Also, this Prioritisation Pentagon could well become a Hexagon or Decagon if other dimensions of interest are identified. The potential issue with adding up dimensions is that you might end-up with all use cases identified as first priority since each of them might be top ranked in a given category. – If you add more detailed dimensions to the Pentagon, you introduce a risk that its usefulness may decrease significantly.
Below are some examples of the Big Data Analytics Prioritisation Pentagon applied to real-life use cases. Even though not all dimensions have a high rating, all cases below have been ranked as first priority.
And here are some examples of low priority cases.
Determining which use cases come first in your Big Data Analytics pipeline depends mostly on your strategic approach to its development. Focusing only on short-term gains would be a mistake and would most likely endanger the future of your program and limit it to a “onetime, interesting experiment”.
Considering the additional dimensions I introduced will help foster the growth of your Big Data Analytics program, and in turn, its long-term cumulative benefits.
About the Author
 Laurent Fayet is Head of Business Intelligence and Analytics at Euroclear SA/NV. Having started his career in the French diplomacy, Laurent then moved to the financial industry by joining Euroclear in 2001. During 5 years, he held various Financial management positions. In 2006, Laurent joined the Application Development and Maintenance division where his focus has been primarily on business transformation and people management.
As a member of the division’s management, Laurent has been responsible for various teams such as head of PSO, head of Project Analysis Office and head of PMO. In 2011, Laurent was appointed Head of Business Intelligence where his main focus areas have been Business/ IT partnership, Agile BI, self-BI, mobile BI and advanced analytics. As a strong believer of the added value of advanced analytics and “Big Data”, Laurent complemented the BI services offering through the implementation of a Data Analytics Lab which main objective is to leverage the added value of data to improve risk management, operational efficiency and customer understanding.
By: Laurent Fayet lbfayet@yahoo.fr
This article was first published on bicorner.com


