

Visual thinking opens up new possibilities that can take your business analysis practices to the next level, writes Grant Wright, Principal Consultant at Scarlett Solutions and co-founder of The Visual Jam.

Grant Wright, Chief Doodler, The Visual Jam Limited
Grant will be presenting the course, Unleashing the Power of Visual Thinking, via Live Streaming 8 June 2021
Business analysis skills continue to be in demand from organisations seeking to deliver effective business change, but in the current business climate, as the rate of change continues to increase exponentially, it begs the question ‘Are traditional BA approaches alone enough?’.
Time for change?
Whilst business analysis remains a valued skill set, the emergence over the past couple of decades of fields such as agile software development, design thinking, and gamification have challenged the role of the traditional business analyst (BA) and their methods. The term ‘Business Analyst’ conjures up an image of someone with a sequential, analytical mind with an emphasis on verbal documentation and technical models that are often abstract and geared towards ‘IT people’. Now whilst this description is probably a little stereotypical (and is certainly not a fair reflection of some of the fantastic BAs I have worked with throughout my career!), it does perhaps highlight the need for BAs to think differently in order to explore problems, identify creative solutions and communicate in a way that is more engaging and accessible to others. This is where Visual Thinking comes in…
The power of Visual Thinking

In its simplest form, Visual Thinking is about seeing things in your mind’s eye and then externalising your thoughts in a visual way in order to aid understanding, explore problems and communicate more effectively.
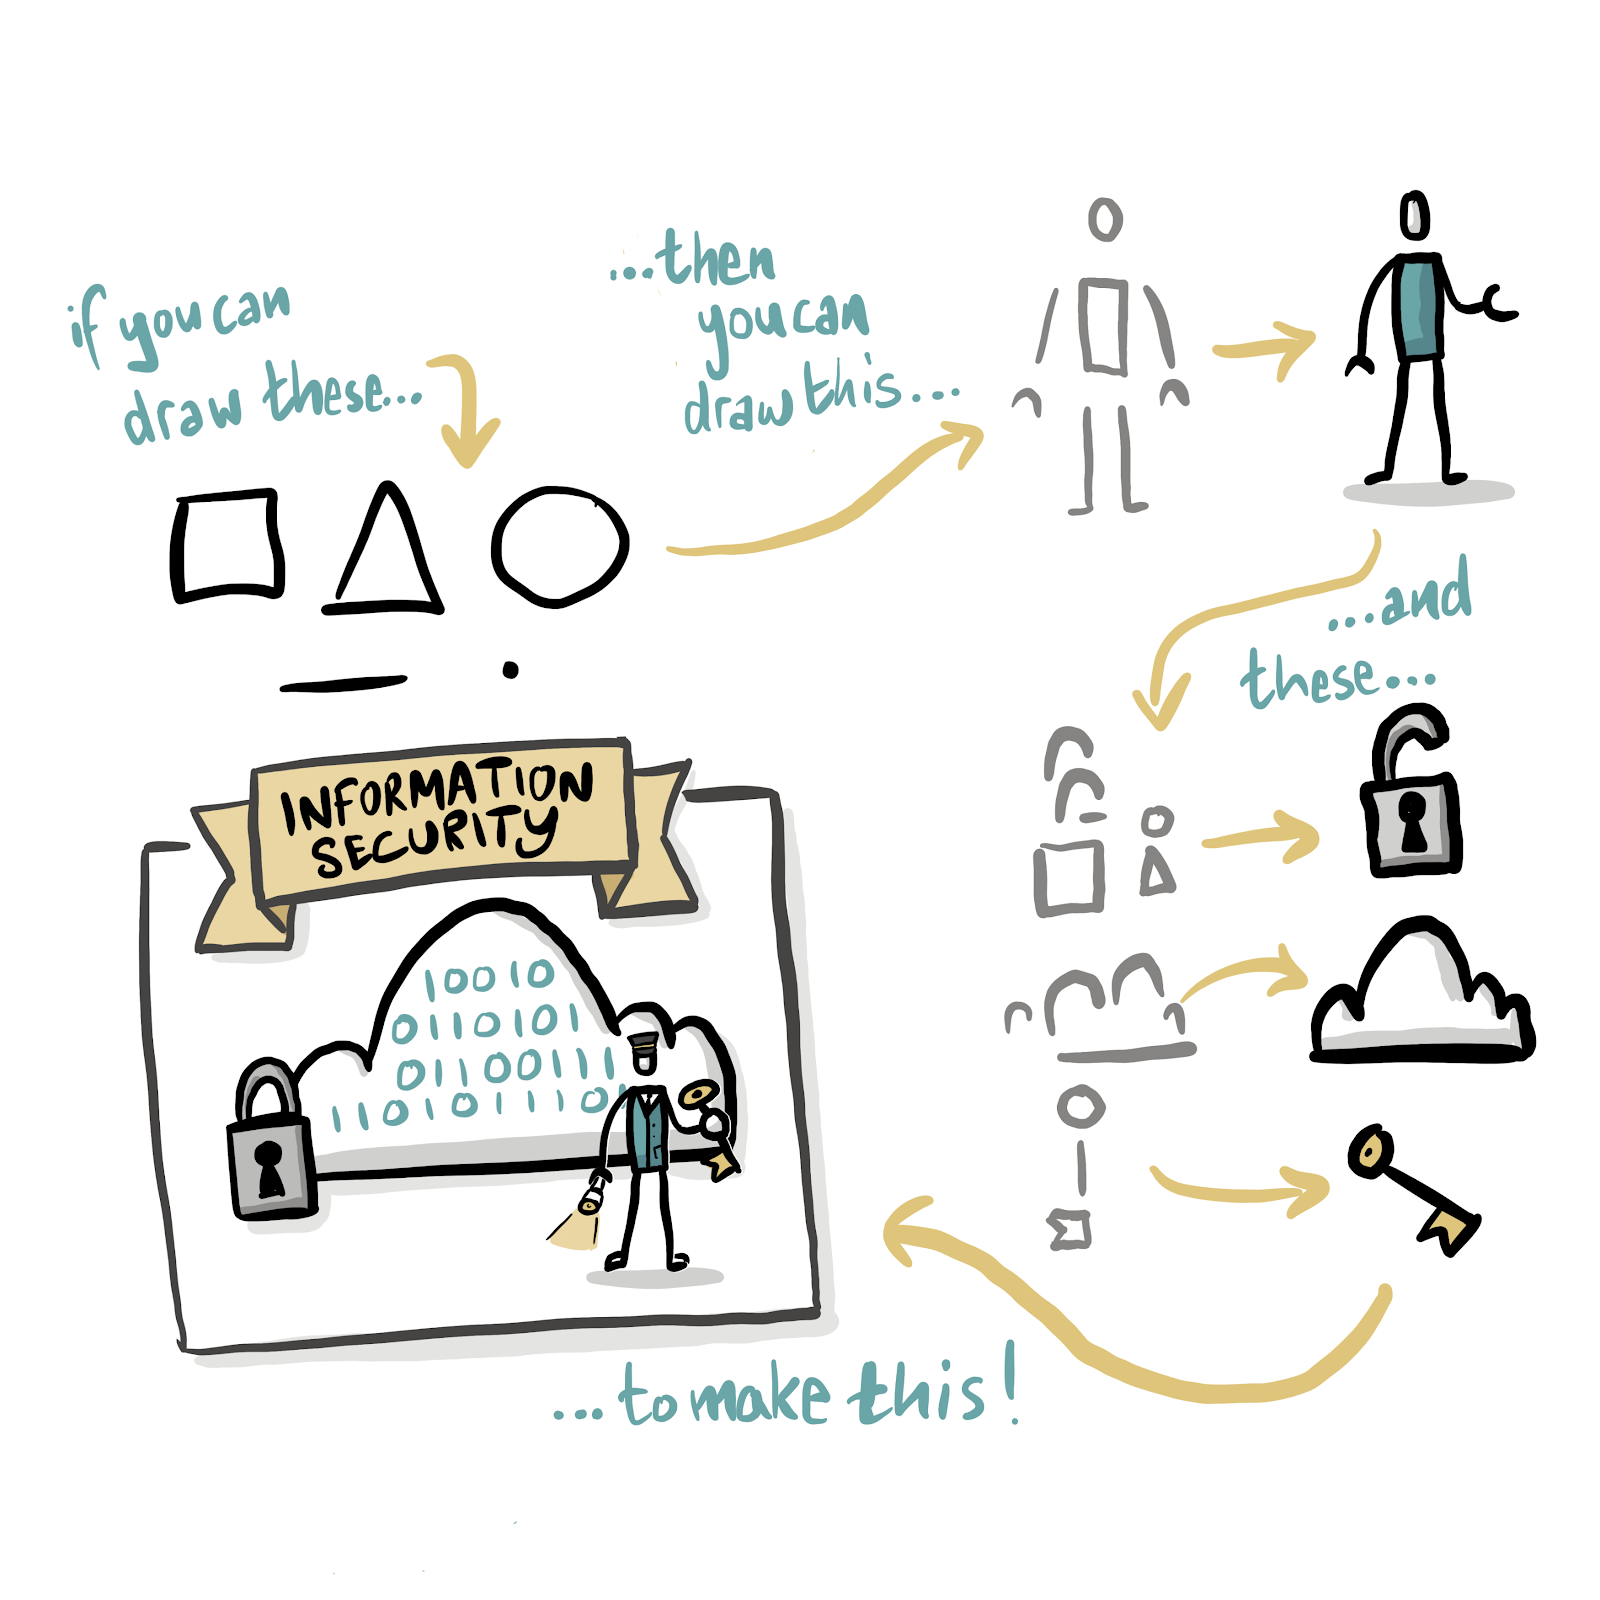
The concept of Visual Thinking is not new, human beings are naturally visual creatures and some of the brightest minds in our history have used visuals to explore their thoughts and reimagine the world (think Leonardo DaVinci’s journals and inventions!). But the application of Visual Thinking in a business context is still in its relative infancy. It has however grown in popularity over the past decade or so with authors such as Dan Roam, Mike Rohde, Willemien Brand and many others advocating the use of simple, hand-drawn visuals to help us stimulate conversation, create shared meaning and enhance our ability to retain and recall information. Their methods vary, but all of these people share the belief that if you can draw simple shapes and stick figures then you are capable of expressing yourself visually. As Mike Rohde says, it’s about ‘Ideas, Not Art’!
The benefits can be wide ranging depending on the context in which Visual Thinking is used, but in his book Visualeadership Todd Cherches summarises three key areas : Attention, Comprehension, Retention. I have also added a fourth one of my own, Exploration (which also creates a nice acronym – ACRE!).
Attention – you can use visuals to grab and hold people’s attention or make content more accessible and easier to understand. For example, in the current climate we see a lot of simple visuals being used to help reinforce key messages about how to stay safe in a global pandemic.
Comprehension – you can use visuals to externalise your thoughts and make connections that are much harder to see using your mind alone. It is said that if you cannot express something in a simple picture then you do not truly understand it. By sketching out our understanding it allows others to literally see what we are thinking, which results in a much richer conversation and invites others to validate our thoughts and fill in any gaps.
Retention – visuals can also be used to help with learning in order to improve our ability to retain and recall information. In fact, there are a number of scientific studies that show that we are able to consume visual information more quickly and easily than the verbal equivalent. Furthermore, when we consume information visually it significantly increases our ability to accurately recall it at a later date.
Exploration – visuals can also be used to help generate ideas and spark creativity. By externalising our thoughts, particularly in a group context, it changes the dynamic of the conversation, inviting different perspectives and allowing us to make connections that we may otherwise have missed. A lot of modern Design Thinking and Customer / User Experience (CX/UX) techniques fall into this category and these can be equally useful for BA practitioners.

Visual thinking for BAs
There are several ways in which Visual Thinking can be applied by BA’s as well as people working in related disciplines such as business architects and agile product owners.
Visual Thinking can:
- enhance existing BA tools and techniques
- open up new possibilities and expand the BA toolkit
- amplify core BA skills and competencies such as communication, problem solving and critical thinking (and many more!)
- boost learning and professional development
Let’s explore this further in the context of a BA’s role throughout the change delivery lifecycle.
Situation investigation & understanding
BAs are often involved early in the change lifecycle, perhaps at the pre-project stage, in order to investigate the current landscape and understand the problems that need to be solved from different perspectives. In this context visuals are arguably essential in order to be able to make sense of the complexity of business systems and their interaction with their external environment.
There are several techniques from the world of Systems Thinking that are either already visual in nature, such as Rich Pictures or Systems Maps, or could be enhanced by combining them with other visual elements. For example, you could visualise a CATWOE analysis to bring to life different stakeholder perspectives or add simple icons to a Business Activity Model or a Multiple Cause Diagram to make it easier to recognise the different elements and the relationships between them.
Exploring and assessing options
Visual templates and games are a great way to spark creativity and generate solution options. www.gamestorming.com offers a huge range of free visual games that can be used when brainstorming ideas, making decisions, setting priorities and much more.
Another great way to to explore and assess options is to use Impact Mapping. Impact Mapping is a strategic collaborative planning technique that helps organisations to explore which deliverables (options) could provide the biggest impact for stakeholders in the pursuit of a specific goal. This method is already visual in its nature, but why not enhance the readability of your impact map even further by using characters and icons to represent the various elements and bring the big picture to life?
Analysing needs and defining requirements
Story maps, personas, empathy maps, customer journeys, experience maps and service design blueprints are all well established visual techniques from the UX/CX community that BAs can leverage to better explore and understand stakeholder needs.
But visual thinking can also be applied to more traditional BA artefacts, such as use case models (let’s give those stick figures some personality!) or data models and state-transition diagrams (could we better illustrate what those abstract rectangles and lozenges actually represent?). You can even use Ben Crothers’ idea of vignette sketches to truly tell a ‘user story’ to agile teams:
Explaining and embedding change
Visuals are also incredibly useful when explaining requirements or a proposed change to both technical and business stakeholders. A simple diagram to illustrate the complexity of a business rule to a developer, or a visual context diagram to help explain the implications of a change to end users, can make a huge difference in the quality of delivery and eventual adoption of the change.
Learning and self-development
Probably the biggest opportunity in the application of Visual Thinking for BAs is not so much in relation to specific BA artefacts or activities, but rather in how Visual Thinking can be used to amplify a BA’s core skills and competencies and help them to learn and develop.
Hand-drawn visuals can be added to presentations to help them stand out, become more accessible and give them a human touch (no more death by bullet point!). They can also be used in ‘heart to heart’ or ‘back of the napkin’ conversations to help build relationships, overcome objections and influence people. You can even use visual templates to help you to organise information (plans, projects, roadmaps etc).

And finally, no article on Visual Thinking would be complete with mentioning Sketchnotes! Sketchnotes are a form of visual note-taking that combine simple drawings with text and typography in a way that makes content more engaging and easier to recall. They can be used to enhance your own meeting notes (which is a great place to get started) or distill the key points from books, conferences and training courses in a way that makes the information more digestible and memorable.
Your new BA super power
So now that you have had a glimpse into the possibilities that Visual Thinking offers, why not take some time to explore this exciting topic further and unleash your new BA super power?
About the author
Grant has over 20 years’ experience of delivering and leading enterprise-scale transformation and digital service design across government and financial services sectors. He actively practices Visual Thinking throughout his work and is passionate about its ability to create alignment, improve understanding and generate creative ideas. Grant actively participates in the visual thinking community and in 2020 he co-founded The Visual Jam, with the aim of helping people to improve creativity and engagement through the use of games, storytelling, visual thinking and other stuff that makes work fun!
Grant has over 20 years’ experience of delivering and leading enterprise-scale transformation and digital service design across government and financial services sectors. He is a Principal Consultant and Director of Scarlett Solutions, a UK based consultancy specialising in business analysis/architecture, agile product management and business transformation. Grant combines his passion for business analysis with tools & techniques from other fields such as user/customer experience (UX/CX), P3M and lean/agile delivery in order to clearly define problems and identify effective solutions for his clients. He actively practices Visual Thinking throughout his work and is passionate about its ability to create alignment, improve understanding and generate creative ideas. Grant actively participates in the visual thinking community and is co-host of The Visual Jam, a regular meetup that aims to help people to improve creativity and engagement through the use of games, storytelling, visual thinking and other stuff that makes work fun!
Copyright Grant Wright, Chief Doodler, The Visual Jam Limited